Monday, March 31, 2014

EconTalk MOOC Podcast

Russ Roberts
podcast interview with Russ Roberts on EconTalk about my experience teaching a MOOC and thoughts on the economics of MOOCs. (The interview was based a bit on my last post here.)

Russ is a very good interviewer, and the EconTalk series quite interesting.

Wednesday, March 26, 2014

The sign of monetary policy, part II

(This blog post uses mathjax to show equations. You should see pretty equations, not ugly LaTex code.)

The ECB is in the news today. They want some inflation, yet the overnight rate is already zero. They're talking about negative interest rates, which leads to a great lunchroom discussion about bags of euros wandering around Europe.  All very interesting.

Yet it brings to mind a heretical thought I explored in an earlier blog post: What if we have the sign wrong on the effect of monetary policy? Could it be that to get more inflation, our central banks should raise rates not lower them? (Leave aside whether you think more inflation is good, which I don't. But suppose you want it, how do you get it?)

It's not as crazy as it sounds.

We know in the long run that higher inflation must come with higher nominal interest rate. Nominal rate = real rate plus expected inflation. Tradition says though that you temporarily steer the wrong way. First lower the nominal rate, then inflation picks up, then deftly raise the nominal rate to match inflation. If you instead raise rates and then just sit there waiting for inflation to catch up all sorts of unstable things happen.

But maybe not. Here is a simple and complete model of the "wrong" sign.

At the end of each period \(t-1\) the government issues \( B_{t-1} \) face value of bonds. In the morning of period \(t\), the government redeems the bonds for newly printed cash. At the end of period \(t\), the government soaks up the cash by selling new bonds \(B_t\) and with lump sum taxes net of transfers \(S_t\). The real interest rate is \(r\) and the price level at time t is \(P_t\). The real value of government debt is then the present value of future primary surpluses,

\[ \frac{B_{t-1}}{P_t} = E_t \sum_{j=0}^{\infty} \frac{1}{(1+r)^j} S_{t+j}. \]

(You can derive this from just watching the flow of money,

\[ B_{t-1} = P_t S_t + Q_t B_{t}; \ Q_t = E_t \frac{1}{1+r} \frac{P_t}{P_{t+1}} \]

where \(Q_t\) is the nominal bond price. Divide by \(P_t\) and iterate forward.)

Now, taking expected and unexpected values of the bond valuation equation

\[ \frac{B_{t-1}}{P_{t-1}} E_{t-1}\frac{P_{t-1}}{P_t} = E_{t-1} \sum_{j=0}^{\infty} \frac{1}{(1+r)^j} S_{t+j} (1) \]


\[ \frac{B_{t-1}}{P_{t-1}} [E_{t}-E_{t-1}] \frac{P_{t-1}}{P_t} = [E_t-E_{t-1}] \sum_{j=0}^{\infty} \frac{1}{(1+r)^j} S_{t+j} (2) \]

(1): By changing the nominal quantity of debt, with no change in fiscal policy \( {S_t}\), the government can freely pick expected inflation. This is like a share split. Doubling debt with no change in surpluses must raise the same revenue, so cut bond prices in half.  It also means the same surplus is divided among twice as many bonds next period, so causing the inflation.

(2): Once debt \(B_{t-1}\) is predetermined,  unexpected fiscal shocks translate one for one to unexpected inflation.

In practice, my little model government adopts an inflation target. This is an agreement between "Treasury" and "Fed," binding both. To the "Treasury," it's a commitment to equation (2): You won't give us any surplus surprises. You will raise as much surplus \( {S_t} \) as needed to validate the inflation target.

The "Fed" figures out what it thinks the real rate is, and announces a nominal rate, supplying as much debt as anyone wants at that rate -- but not touching fiscal policy \( {S_t} \).  By fixing the nominal rate, and thus fixing expected (inverse) inflation, (1) describes the amount of debt \( B_{t-1} \) that will be sold at this auction. (Equation 1 sounds a little warning, however. That might take a lot of debt! To change the price level 5%, the government has to issue 5% more debt, or about a trillion dollars.)

In this model, to raise (expected) inflation, the Fed and Treasury agree to a higher inflation target, and then the Fed raises rates.

This isn't that deep. Again, we've known about \(i_t = r_t + E_t \pi_{t+1} \) for a long time. But this fills in the determinacy and dynamics question. Yes, if the government just fixes \(i_t\), once \(r_t\) sorts itself out, then inflation must follow.

Ok, I left out stickiness, short runs, and so forth. But this seems (to me) like a pretty compelling simple long-run model of interest rate and inflation targeting, and it at least spells out a mechanism by which raising nominal rates and waiting for the inflation to happen will not be completely destabilizing.


Here is some history. I plotted the change from a year ago of inflation, together with the  3 month treasury rate. You should mentally shift the inflation rate to the right a year, as interest rates are associated with future, not past inflation, but I couldn't get Fred to do that. Once you do, you see pretty much my story. Higher interest rates lead to higher inflation. And the history since 1982 has been slowly lower interest rates leading to slowly lower inflation. Of course you can say that higher interest rates anticipate higher inflation. But there's precious little evidence for the opposite story, that higher interest rates lower inflation and vice versa.

Well, except 1980-1982. There are some short term dynamics, but if you're worried about decades of no inflation like Japan, maybe you shouldn't be thinking about vigorous short run dynamics.

More deeply,  we are, and will remain, in a brave new world, where the mechanism for short-run dynamics may have changed completely.  We are living the Friedman Rule -- $2.5 trillion or so of excess reserves, and interest rate = 0 mean that money and bonds are the same thing.


Here's a conventional reserve demand picture. We're out at the right edge. The conventional mechanism would have the Fed unwind $2.45 trillion of open market operations, until the reserve demand curve wants a larger interest rate, as illustrated by "really?"

Everything I hear out of the Fed says they won't do that.  We will stay satiated in liquidity, we will stay on the horizontal axis of the money demand curve, we won't go back to rationing reserves. Instead, they'll just raise the whole graph by paying more interest on reserves.

Living the Friedman optimal quantity of money is good. But who is to say any theory or experience based on the old mechanism will still apply to dynamics? 1980 was arguably a strong move on the left side of the graph, creating all sorts of monetary havoc. Raising the whole graph and leaving it there, with no rationing of liquidity whatsoever, is a completely different experiment.

As before, I view this just an intriguing possibility, not settled theory, and I'm using today's news to think out loud.

Some credit (without blame if you think this is all nuts):  Lars Svensson motivated this thought at a conference a while ago, while I was expounding on the fiscal theory. Lars pointedely asked why I thought inflation targeting countries had done so well. Well, I think this is the answer: The inflation target binds the Treasury as much as it does the the central bank. Then together they slowly lower rates to lower inflation, the slowly part to tiptoe over shortrun dynamics.


Interviews

I did two interviews that blog readers might enjoy.


This is an interview with Jeff Garten at Yale, covering financial crises and reform/regulation efforts rather broadly. Source here. It's part of a very interesting series of interviews on the "future of global finance" with lots of superstars. I give Niall Ferguson the prize for most creative  author photo.


This one is a podcast interview on the ACA and how free-market health care can work, with Don Watkins at the Ayn Rand institute's "debt dialogues" series. If you follow the link you get several formats.

Monday, March 24, 2014

Goodman Vs. Emanuel

On the fourth anniversary of the ACA, Saturday's Wall Street Journal had an excellent pair of pro and con OpEds from John Goodman "A costly failed experiment" and Ezekiel Emanuel "Progress, with caveats."


Goodman starts with a zinger. The point was universal coverage. "Four years later, not even the White House pretends that this goal will be realized."

The best parts, to me: After noticing that families near 14% of the poverty level get about $8,000 in medicaid benefits, or about $11,000 worth of subsidies on exchanges,
the employees of a hotel who earn pretty much the same wage ... will be forced to have an expensive family plan... the ObamaCare mandate amounts to about a $10,000 burden on these businesses and by extension their employees.
This leads to a novel (to me) economic effect.
As businesses discover that almost everyone who earns less than the average wage gets a better deal ...in the exchange or from Medicaid, and that most people who earn more than the average wage get a better deal if insurance is provided at work, trends already evident will accelerate. Higher-income workers will tend to congregate in firms that provide insurance. Lower-income workers will tend to work for firms that don't. But efficient production requires that firm size and composition be determined by economic factors, not health-insurance subsidies.
And John is prescient on just why exchange policies seem to be pretty awful:
Under ObamaCare, insurers are required to charge the same premium to everyone, regardless of health status, and they are required to accept anyone who applies. This means... they have strong incentives to attract the healthy (on whom they make a profit) and avoid the sick (on whom they incur losses). 
The result has been a race to the bottom in access and quality of care. To keep premiums as low as possible, the insurers are offering very narrow networks, often leaving out the best doctors and the best hospitals.
He has some nice alternatives, including
giving everyone the same universal tax credit for health insurance would be a good start. More easily accessible health savings accounts for people in high-deductible plans is another good idea. 
Every provision in ObamaCare that encourages employers either not to hire people or to reduce their hours should go. Everything in the law that prevents employers from providing individually owned health insurance that travels from job to job should go. And everything that makes HealthCare.gov more complicated than eHealth  (a 10-year-old private online exchange) should go.
By contrast, I was interested that Emanuel, an architect of the law, was so weak in its defense.
Look at access to care. According to Gallup, the percentage of uninsured Americans declined from 18% in the middle of 2013 to 15.9% in the first quarter of 2014..
Interesting that pro and con opeds start with essentially the same opening sentence! The glass is indeed 85% empty. Ezekiel passes on the canard that health insurance is "access to care."

But most important, recall that the idea was not simply to expand Medicaid and high-subsidy insurance. "Free health care for all" would have produced a lot of people signing up. That's not the measure of success.

A very interesting paragraph:
Look at quality. In 2010, as part of the Affordable Care Act, the federal government launched the Partnership for Patients, a push to reduce infections and other preventable errors and injuries that occur in hospitals through financial incentives. The results have been dramatic. In three years, avoidable central line infections have dropped 41%. Ventilator-induced pneumonias have dropped 55%. Unnecessary, elective C-sections have dropped more than 50%. Hospitals are also getting better at preventing falls, which have declined more than 11%. Overall, the Partnership for Patients has prevented roughly 15,000 deaths, averted hundreds of thousands of injuries, and saved more than $4 billion.
This was news to me. And astonishing. After all these years of complaining that doctors are too careful because of out-of-control liability, it took a Federal program to get doctors to wash their hands and prevent falls?

Even if it did, though, this point has nothing to do with the ACA, exchanges, and the rest! The government could easily have passed this magical program without touching health insurance. This is like saying we should fly to Hong Kong first class because the snacks on the plane are good.

He mentions the recent slowdown in costs. But he concedes there was a recession, and that took place before the ACA set in. No need to restart that fight. We'll see if the ACA really ends up being cheap.

But Emanuel concedes all is not right and needs some pretty radical fixing.
Step one would be to operate the exchanges like a cutting-edge e-commerce website, not a traditional government program. ...The challenge is more than getting the sites to work faster and more reliably. The challenge is to get them to run like Zappos or REI, with a relentless focus on improving the insurance offerings, attracting customers, and facilitating an easy, informative shopping experience.
 I just love this paragraph. It's written in a strange new voice that takes over policy discussions -- the regulatory passive. "to operate..getting the sites to work... to get them to run...." Just who is going to do all this toing? News flash: the ACA is a "government program," and it's run by Health and Human Services? When did government programs ever not operate like, well, government programs? When did any government program  relentlessly "focus on improving the insurance offerings, attracting customers, and facilitating an easy, informative shopping experience." Try the Post Office some day. But no,
..there must be constant improvement. And it can probably occur only with a 21st-century, private-sector management structure—one that empowers a CEO, probably with health-insurance experience, and a team of tech-savvy management specialists, to run the entire operation.
Ah, just bring in a czar to command the operation. 
Step two would be to change the way doctors and hospitals are paid as quickly and efficiently as possible. In order to control costs and improve quality, there needs to be a transformation in the way care is delivered. There needs to be continuous monitoring of patients in order to intervene early to prevent acute exacerbations of chronic illnesses. And when patients do get sick, there needs to be a greater focus on treating them outside of the hospital so the care they receive is safer, more efficient and lower-cost.
That wonderful regulatory passive again. "to change... there needs to be a transformation... there needs to be monitoring...there needs to be a greater focus." Who prey tell is going to do all this stuff? Why are they going to do it? Who is going to pay for it?  

Interestingly, the bottom line ends up not being so different from Goodman.  Government programs act like government programs -- for example following arcane procurement rules -- because, by Federal Law they have to run like government programs. And those laws aren't silly, they were put in place because otherwise people steal. 

There is a place filled with "CEOs with health-insurance experience and teams of tech-savvy specialists." There is a place where "big transformations in the way " services "are delivered" happens. There is a place that "private-sector efficiency "happens. It's called "the private sector." Really, Emanuel has without realizing it written a pretty effective piece for deregulation of the whole mess. 

And, though his closing paragraph praises the law, consider the closing sentence
Now is not the time for autopilot.  Lawmakers need to enhance the exchanges and more rapidly adopt alternatives to the fee-for-service payment system.
This actually calls for legislative and regulatory changes no smaller than what Goodman calls for!


Stein on Financial Stability in Monetary Policy

Fed governor and Harvard Professor Jeremy Stein gave an important speech on March 21, Incorporating Financial Stability Considerations into a Monetary Policy Framework. I have a few minor criticims, specifically on standard errors, causal mechanism, and Lucas critique. But it's great for Jeremy to think out loud this way, and give me occasion to do the same. You should read the whole thing.

Stein's bottom line:
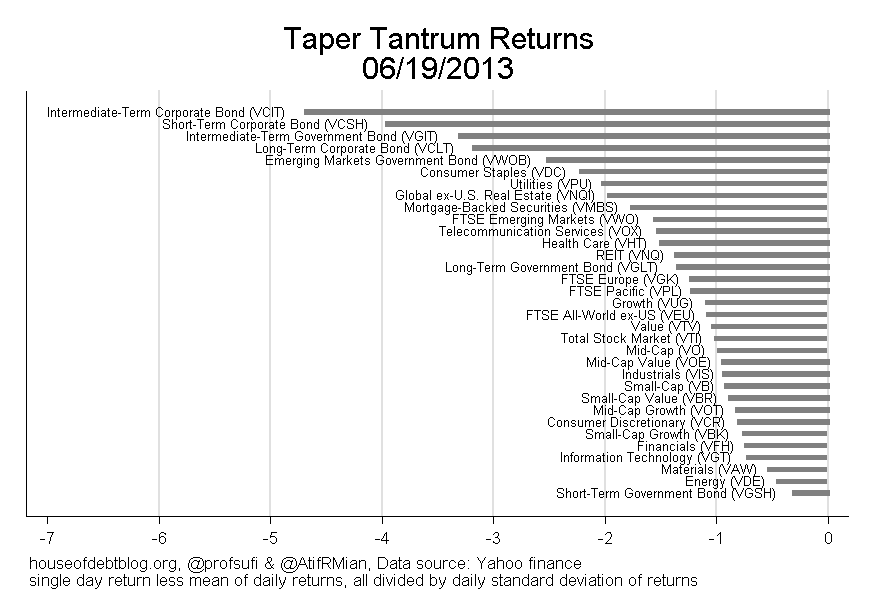
...all else being equal, monetary policy should be less accommodative--by which I mean that it should be willing to tolerate a larger forecast shortfall of the path of the unemployment rate from its full-employment level--when estimates of risk premiums in the bond market are abnormally low.
This view has put Stein a bit in the camps of the hawks, meaning simply those who for one reason or another think the time to raise rates is sooner rather than later.

This is an interesting framing. Why did Stein say "forecast shortfall of the path of the unemployment rate from its full-employment level" and not just "more unemployment?" Stein is pitching the argument, I think, at the other FOMC member's sensitivity to unemployment.  If the Fed ultimately cares about unemployment a year from now, the probability of a shock that would unexpectedly raise unemployment matters as much as the Fed's expected value. His idea: a bit of tightening might raise the level a bit, but lower the variance.

"How Do You Measure Financial Market Vulnerability?"  Stein thinks about leverage measures, and concludes they are not useful in real time, that to the extent they can be measured, they are better addressed with regulation rather than interest rates. Most of all
How, if at all, does monetary policy influence the evolution of the ratio? Without an answer to this question, it is hard to say how much one would want to alter the stance of policy when, say, the ratio is abnormally high relative to trend.
He concludes that the Fed should watch risk premiums -- the expected excess return on long term treasuries and corporates -- and be ready to tighten if risk premiums seem too low. Essentially, the Fed should add a new term to the Taylor rule,

interest rate = phi_pi*inflation + phi_u*unemployment + phi_r*risk premium. 

(my interpretation, not the speech.)
As an illustration, consider the period in the spring of 2013 when the 10-year Treasury yield was in the neighborhood of 1.60 percent and estimates of the term premium were around negative 80 basis points (3). Applied to this period, my approach would suggest a lesser willingness to use large-scale asset purchases to push yields down even further, as compared with a scenario in which term premiums were not so low.
But measuring the term premium is tricky stuff. It's not just the spread between long bond and short bond yields. If long bonds are 1.60% and short bonds are 0%, it might just be that everyone expects interest rates to rise in the future, and expected returns are the same for holding any type of bond. The "risk premium" is how much of that spread exists over and above (or in this case, under and below) people's expectations of rising interest rates.

So how do you separate the yield spread into expectation and risk premium  components? Footnote 3:
The 10-year nominal rate hit 1.63 percent on May 2, 2013. An estimate of the term premium based on the oft-cited methodology of Kim and Wright (2005) was negative 0.78 percent on this day.
OK, how do Kim and Wright come to this conclusion? Basically, by running regressions. They (we) examine, in the past, what configuration of bond prices and other variables have been followed by interest rate rises ("expectations hypothesis"), and what configuration has been followed by good returns to bond investors ("risk premium")?

This is an imprecise business. Regressions have standard errors big ones. Regressions vary even more by specification -- which variables do you put on the right hand side. Having written two papers on bond risk premiums, I can attest those standard errors and specification uncertainties are large.

At a minimum, I think Stein would do all of us a favor if he would include standard errors and specification errors.  My guess though is that they would be at least one if not two percentage points. The risk premium was somewhere between negative 2 and positive 2 percent, not -0.78%. That might undermine his case (!), but perhaps the Fed can write an internal memo that everyone has to quote numbers with standard errors. So, the natural rate of unemployment is not 6.500%, but has at least a percent or two uncertainty as well.

The same point holds for the much more important credit spreads. If the BAA bond spread is 1%, does this mean a 1% chance of default (including recovery)? Or does it mean that the price is temporarily low and people holding BAA bonds will earn on average 1% more on other assets? Solid research breaking out this spread, also by examining historical correlations, is just beginning.

More deeply,  the historical correlations come from a sample in which the Fed was not affecting long rates.  I don't think QE did much to long rates, but the Fed does, with some sort of "friction" or "segmented market" in mind. That would make those regressions pretty useless now. If you force the weather forecaster to say it will be sunny, the usual correlation between forecast and reality will fail.

More deeply still, there is a classic Lucas Critique problem. Historical correlations can be counted on to move as soon as the Fed exploits them for policy. If low short rates were correlated with low credit spreads which were correlated with subsequent financial turmoil in the past, will raising short rates raise credit spreads and lower financial turmoil now?

The cure is to understand the causal structure, but here we're all really at a loss. Everyone writes about how low interest rates lead to a "search for yield" and low risk premiums, but how? Economic theory pretty much divorces the level of interest rates from the risk premium between different securities. If anything, simple correlations go the other way: low interest rates have happened in the depths of recessions, when risk premiums are highest.

Stein knows all of this of course.
Of course, there are many caveats. Foremost among them is the fact that the ability of increases in the EBP ["excess bond premium"] to predict future economic activity may not reflect a causal link from the former to the latter. Perhaps there are economic slowdowns that are caused entirely by nonfinancial factors, and, when investors see one on the horizon, they get skittish, causing the EBP to rise. If so, it would be wrong to conclude that easy monetary policy--even if it does, in fact, cause lower risk premiums--has any causal effect on the probability of a future slowdown. So at this point, the evidence that I have reviewed can only be thought of as suggestive. 
Making progress on these difficult issues of causality will likely require a clearer articulation of the underlying mechanism that leads to such pronounced asymmetries in the relationship between credit spreads and economic activity. If a causal link is, indeed, present, what is there about it that leads increases in spreads to have a much stronger effect on the economy than decreases? I suspect that the answer has to do with something that mimics the effect of leveraged losses to financial intermediaries--and the attendant effect on credit supply. For example, GZ document that their EBP measure is closely correlated with the credit default swap spreads of broker-dealer firms. The reason could be that losses on their inventories of risky bonds erode the capital positions of these firms, which might in turn compromise their ability to provide valuable intermediation services. Alternatively, a similar mechanism may play out with open-end bond funds, whereby losses cause large outflows of assets under management, again compromising the intermediation function and aggregate credit supply.
So, if there is a correlation between the level of the short rate, the term premium and the risk premium, and a correlation between those and financial stability, it's not about fundamental business cycle risk, it's something about frictions in the intermediation system. We are awfully far from understanding that process, and especially understanding it well enough to manipulate it!

This statement also somewhat contradicts Stein's earlier view that we shouldn't watch and respond to leverage: "How, if at all, does monetary policy influence the evolution of the [leverage] ratio?" asked Stein above.  But this is awfully speculative on how monetary policy affects risk premiums, and through them financial stability.  Finally, frictions by definition don't last forever. We are talking, not about a month or two of higher rates and higher risk premiums, but about rates and premiums that last for years. Do these frictions really last for years?

Stein is duly cautions
...let me emphasize the conjectural nature of these remarks. Even if this broad way of thinking about the problem turns out to be useful, there is a ways to go--in terms of modeling and calibration--before it can be used to make quantitative statements. Thus, at this early stage, I would not want to claim that one is likely to get policy prescriptions that differ significantly from those of our standard models. We will have to do the work and see what emerges. 
But understanding all this will take years.  Do we really get to wait?  Is Stein really making speeches to spur a decade long research agenda? Given the equally tenuous theorizing on the "dove" side about the relation between low interest rates and long-term unemployment or the employment-population ratio, should it wait? How should the Fed act with so much uncertainty about basic cause and effect? I'm glad I'm not on the hot seat.

I  applaud the closing comment.  Recessions are really about risk premiums.
...one of the central and most widely shared ideas in the academic finance literature is the importance of time variation in the risk premiums (or expected returns) on a wide range of assets. At the same time, canonical macro models in the New Keynesian genre of the sort that are often used to inform monetary policy tend to exhibit little or no meaningful risk premium variation.  Even if most of the specifics of what I have had to say in this talk turn out to be off base, I have to believe that our macro models will ultimately be more useful as a guide to policy if they build on a more empirically realistic foundation with respect to the behavior of interest rates and credit spreads.

Friday, March 21, 2014

A World Without Banks?


A graphic short story in this month's "capital ideas."  Click on the link or the image to read the whole thing (4 panels). If you can find the print magazine, the visual quality is much better. I think it does a great job of making economic ideas visual without too many talking heads and big balloons full of text. More of these to come in future "Capital Ideas." More work from this unusually talented graphic novelist here. (My side of this "debate" is a bit captured here.)

Thursday, March 20, 2014

Hello Discretion

Today, the much-anticipated first Fed policy statement of the Yellen era came out. FOMC statement, here.

Some interesting tidbits:
The Committee will closely monitor incoming information on economic and financial developments in coming months and will continue its purchases of Treasury and agency mortgage-backed securities, and employ its other policy tools as appropriate, until the outlook for the labor market has improved substantially in a context of price stability. ... asset purchases are not on a preset course, and the Committee's decisions about their pace will remain contingent on the Committee's outlook for the labor market and inflation as well as its assessment of the likely efficacy and costs of such purchases. 
In determining how long to maintain the current 0 to 1/4 percent target range for the federal funds rate, the Committee will assess progress--both realized and expected--toward its objectives of maximum employment and 2 percent inflation. This assessment will take into account a wide range of information, including measures of labor market conditions, indicators of inflation pressures and inflation expectations, and readings on financial developments. 
With the unemployment rate nearing 6-1/2 percent, the Committee has updated its forward guidance. 
In other words, the committee will do whatever it feels like doing, whenever it feels like doing it, based on whatever information it decides is relevant. The Committee updated its forward guidance by throwing it under a bus, or at least by clarifying that it is of the form "here is what we think now we will want to do in the future, but we can change our minds at any time."

The larger context is the debate between commitment or rules and discretion. Discretion wins.

You might expect me to be fulminating. I'm not. (Though I'm waiting for a rules vs. discretion blast from John Taylor! (Update: here it is.)  I regard this as simply stating reality.

Our Fed will operate with complete discretion. On this basis, I was pretty critical two years ago of various proposals that the Fed announce ex-ante that it would keep interest rates lower for longer than it would desire ex-post; to just state some new "rule" or "commitment" that would lower interest rate expectations. I argued, there is no way anyone will believe such a purely voluntary commitment. If it's going to be full discretion, we might as well be upfront about it and stop the charade. Rules where every day is a special exception are not rules. If it's going to be a rule, setting one up requires a lot more than just FOMC statements and "guidance."
Voting against the action was Narayana Kocherlakota, who supported the sixth paragraph, but believed the fifth paragraph weakens the credibility of the Committee's commitment to return inflation to the 2 percent target from below and fosters policy uncertainty that hinders economic activity.
Narayana is always interesting. The fifth and sixth paragraphs are the ones I quoted above. Narayana wants more rules and commitments. But... from the dovish side!  He's worried people don't know the Fed wants more inflation.

But he is right. The problem with full discretion is that it's a lot harder to "anchor" expectations. The Fed is going to dig itself deeper and deeper into this world in which markets hang on every whisper. Maybe full bore discretion isn't such a good idea after all.
 Fiscal policy is restraining economic growth,
This must be a joke. Oh, no, I get it, the Fed has woken up to the growth-sapping effects of high marginal tax rates and a chaotic code. I wish.

University Debt

Bloomberg has a story on the University of Chicago's big debt expansion. Obviously, it's a topic around faculty lounges too.

A few thoughts. Why does a university simultaneously borrow $3.6  billion but have $6.7 billion Invested? If borrowing is such a big deal, why not just spend the endowment on new buildings?

Answer: universities can borrow at municipal rates, free of federal tax to the lender, if they are building something. Borrowing at tax-free rates makes financial sense, even you just stuff the marginal dollar into endowment. Of course the endowment is not invested in Treasuries -- universities don't do simple tax arbitrage. So the model is more that of a leveraged hedge fund -- borrow at low tax-free rates, up to the limit imposed by tax law, and invest in high risk, (hopefully) high-return projects like hedge funds, private equity, real estate etc. The fact that investment returns are also not taxed makes this a doubly advantageous strategy. Donors: if you give now, your gift grows tax-free, while if you earn the rate of return and then give the money to the university, you pay taxes on the intervening returns.

Borrowing long term is an exceptionally good deal right now. "...borrowing costs remain close to five-decade lows.  The institution sold $149 million of federally tax-exempt bonds last year, including a portion maturing in October 2052 that priced to yield 3.5 percent, Bloomberg data show"

Short-term rates are even lower, but raise the prospect of rollover risk. You have to sell new debt to pay off the old debt, which might be at much higher rates, and markets might not sell it at all. Ask Greece. I've been advocating the US government dramatically lengthen its maturity while the getting is good, and the same principle applies to a university. These low rates are, apparently, locked in for a generation. Only a decades-long deflation will make them seem a bad idea.

So, it's really not about the borrowing -- the U of C could just spend the endowment, but it makes more sense to borrow against the endowment instead. It's about the building.

Here is what I think is happening: The U of C's leaders think there will be about 5 big, global, high-prestige, science-oriented, big-idea-generating research universities left in 20 years. The gap between those and second-rate schools will grow, especially as the top 5 educational content goes online. Who wants to take an online class from the #11 university? We want to be one of the big 5. We're behind, especially on the transition from arts and humanities to science and engineering. And if research funding moves from government to billionaires, scale and rank will be even more important. This is the "ambitious program to improve campus life while bolstering highly regarded academic programs." Harvard (5.7) and Stanford (4.8) have more debt than us (3.6) and Yale (3.6) the same, an indication of who is in this race, and that they're ahead of us.

If the ratio of debt to endowment is high, the U of C doesn't have a problem of too much debt. It has a problem of too little endowment.  This is something that the development office would like you to help with, very much, by the way. There are buildings still left to name! Bloomberg suggests that some competitors have a better idea: "relying more on fundraising and less on bond financing." Hmm. Last time I talked to the development people, they were not sitting around having margarita parties and turning down checks because we'd rather borrow the money.

But left with a choice, do you want to leave a mediocre university with a great endowment and credit rating, or a great university with a mediocre endowment and credit rating, our leaders are making a big, bet-the-company move, of the type that we write about in case studies when it works out. 

Endowments are a bit of a puzzle anyway.  Imagine this is a corporate finance case class, and we're looking at a company that has billions of dollars of extra cash squirreled away. We would say, there is a company with no good ideas. The rate of return to investing internally and expanding is obviously worse than the rate of return they see in markets.  I also observe that high-endowment universities seem to be proportionally more inefficient, with much more staff, and internal bureaucracy. It takes a lot more paperwork to get expenses reimbursed when I travel there. They don't pay higher salaries to their faculty, which is, of course, the number one most important thing for a university to do! Endowment seems to be to universities as oil is to third world countries. You can either read that observation as confirmation of poor internal prospects, or verification of the corporate theory that internal funds get misused by managers. In corporate classes, we say the company should just return cash to shareholders.

Now, universities don't have shareholders, and they don't pay taxes on their investments -- a big advantage over the long run -- so operating an endowment makes a lot more sense. Still, Chicago has always been lean, efficient, under-endowed, attentive to the bottom line, and it's pretty clear we'll be that way for a few more decades! It's also clear our leaders see a high rate of return to investing internally, which is a good sign for any business.

Well, what about the bond rating? I find it a bit curious that bond rating agencies worry about lending to an institution with twice as many assets (endowment) as debt, before you count up the value of the buildings that the bonds finance. But that's their business. This all seems second order. We can always sell endowment to build buildings if we want. The rating causes a lot of on-campus grumbling, and it generates pressure for the parts of the university that generate profit surplus, like the business school, to keep doing so. But perhaps that grumbling will apply necessary pressure for other parts of the university to become as efficient.

Disclaimer: I have zero inside information, all of this is personal opinion only and based only on reading the same public sources you do.

Update:  Chris Hrdlicka and Thomas Gilbert at the University of Washington have a nice recent paper analyzing university endowments. "We show that a risky and large endowment signals a combination of three university characteristics: low productivity marginal internal projects; self-interested stakeholders resisting productive expansion; or binding constraints on maximum endowment payouts."

Monday, March 17, 2014

House of Debt

Atif Mian and Amir Sufi have started a blog related to their new book, "House of Debt." Amir and Atif are admirably data-oriented, which ought to make for good reading.

Today's post "Fed Meetings and Asset Prices" is a good example. They put together one-day returns on the June 19 "taper tantrum" when the Fed announced it might (heavens) start tapering bond purchases. There is, of course, a large literature studying announcement effects. Atif and Amir  put together an unusually wide spectrum of asset classes.


It's interesting that corporate bonds are most affected. Really, the credit spread widened. It's interesting that the intermediate government bond is hurt more than long and short -- maybe there is something to the idea that the Fed really affects the 10 year maturity where it's doing more buying. It's interesting that banks (financials) are not much affected. (Though be careful, these returns are scaled by volatility.)

My thought: This cross section is most interesting as an illumination of why QE might or might not work. Markets move, but never tell you why they move, and analysts jump too quickly to the conclusion that these reactions measure the direct economic effect of quantitative easing. Here are some theories to distinguish:

  1. QE works directly, by changing the M in MV=PY. The announcement of tapering means there will soon be less M so we should primarily see output and inflation effects. 
  2. QE works by lowering the long-term interest rate via some sort of segmented markets story. Thus, this is news that the yield curve will start to steepen, with no news about the low end
  3. QE is irrelevant per se, the Fed is buying green M&Ms in return for red M&Ms. But we all know that first comes tapering, then comes interest rate hikes, (then comes macroprudential meddling?) So, this is news that the short end of the yield curve will rise sooner than expected, with any long end effects coming from expectations hypothesis logic alone. We update to a higher but flatter yield curve.
  4. QE is completely irrelevant, but announcements reveal the Fed’s analysis of economic activity. The Fed is one of the most thoughtful economic forecasting shops around, with loads of private information, especially about what’s going on at the TBTF banks. If the newspapers had said “Mohamed El-Erian says economy stronger, rates to rise in 14”, markets might well have moved on the news too. 
  5.  QE is completely irrelevant, period. Markets think the Fed matters a lot, but it doesn’t. We’re out of rational expectations equilibria because nobody has seen a $ 3 trillion balance sheet, interest on reserves, and zero rates before. When in 44 AD the high priest of the temple of Jupiter came forth the day following the ides of iulius, to announce that he had spied the pattern in the murmuration of starlings, and that the harvest would taper down this year (I totally made this up), Roman grain futures markets fell. Are we really so much smarter?

I find the cross sectional results most interesting in how they might help us sort these stories out. Amir and Atif speculate a bit about what it means, and promise more in future posts. Worth watching.

Monday, March 10, 2014

Goodman Plan

John Goodman has an excellent health-care piece at National Review Online. You don't have to subscribe to every element of his "plan" to appreciate many of his trenchant observations of coming Obamacare disasters. (Any "plan" that advertises it is crafted to meet perceived political constraints is bound to be less than perfect as a matter of economics.)

The slight weak point: he keeps community rating and guaranteed issue, but talks about how people need to sign up immediately or lose that benefit as they do in Medicare. I'm not sure just how he wants to do that or if that's realistic. But the big picture is right on: deregulated, individual, portable insurance.

Transferability between plans is a nice point:  "if an expensive-to-treat patient moves from Plan A to Plan B, the former has to compensate the latter for any above-average expected costs — just the way Medicare compensates private plans."

But read it for the mess we're in now. Lots of looming problems have not made headlines. Yet.

Asness and Liew on Efficiency

Source: Institutional Investor
Cliff Asness and John Liew -- Chicago PhD's and now founding principals of AQR -- have a nice piece in Institutional Investor on Fama, Shiller, Nobel Prizes and efficiency.

They do a good job on the joint hypothesis theorem -- maybe a more important part of Fama's 1970 paper than efficiency itself -- and value and momentum strategies.

They point out one big difficulty for the inefficiency view (p.5). If value stocks are just overlooked and growth stocks irrationally overpriced, why do value stocks all subsequently rise or fall together, and growth stocks go the other way? "Cheap stocks would get cheaper across the board at the same time. It didn't matter if the stock was an automaker or an insurance company. When value was losing it was losing everywhere."

A second very important theorem: the average investor must hold the market portfolio, so alpha is a zero sum game. If you're going to profit, it helps a lot to identify just who the morons are whose money you are taking and why they're willing to give it to you. Everyone thinks the other guy is "behavioral." Are you sure it's not you?

Cliff and John have a theory (p.5) "we've seen that a lot of individuals and groups (particularly committees) have a strong tendency to rely on three to five-year performance evaluation horizons. Of course, looking at the data, this is exactly the horizon over which securities most commonly become cheap and expensive... these investors act like momentum traders over a value time horizon."

Be careful though, so far they are assuming a value effect -- "securities become cheap" means expected returns have already risen. How does this behavior than cause a value effect? They go on: When these people buy or sell, "price pressure" (from people slowly and passively rebalancing over a 3-5 year horizon?) "leads to some [additional!] mispricing (inefficiency) in the direction of value." Hmm, it sounds pretty thin guys.

A deeper and more important criticism of the risk-factor interpretation: "many practitioners offer value-tilted products.. But if value works because of risk, there should be a market for people who want the opposite...Some should desire to give up return to lower their exposure to this risk... we know of nobody offering this systematic opposite product (long expensive, short cheap)."

This is one my MBA students have heard for a while. Go back to Fama and French's story for the value premium as risk factor. People whose labor income or nonmarketed business income is correlated with value stocks should shun value stocks on diversification grounds. If there are more such people (steel workers, say) than people whose human capital or business income is correlated with growth stocks (computer programmers), then the former push down the price and up the expected returns of value stocks.

The trouble is, for everyone that an investment firm finds who has not yet thought about this premium, bought value to write insurance, there should be someone else who has not thought about insurance and wants to sell value to buy insurance. Or, the premium will go away.

So where are these customers, who hear about AQR and DFA and say, "Great, I want to short that!" (The problem is even worse for momentum, for which there isn't even a story.)

In fact, Cliff and John are exaggerating here. There are plenty of people offering the opposite product. There are lots of growth funds for sure! There must be shortable value ETFs as well.

And I think that observation paints a partial answer. Lots of people do overweight growth stocks, and thus underweight value stocks, though the value premium says the growth stocks are overpriced. Why? Well, each one of them thinks their growth stocks are the good ones, and they're taking alpha from the other morons who picked the wrong growth stocks. Growth stocks are where all the trading and volume and information and new products and excitement is.  Invest in railroads, steel and banks (value)? That's nuts, you want to be in the wave of the future, Google and Facebook, thinks the average investor. Jim Davis (Table 3 here) actually finds positive alpha among growth managers.  This is not to say it's all "rational." A rational story for information trading is hard to find. But it certainly does paint a different picture of who is buying growth stocks than just "morons" and "dumb committees."

Source: Journal of Political Economy
A little example. Here is a revealing table from Owen Lamont and Dick Thaler's classic 3 com and Palm paper. In the 1990s internet boom, 3com carved out 5% of Palm's shares, keeping 95% which it spun off -- gave to 3com shareholders -- 6 months later. Palm share prices exploded, to the point that you could buy Palm much cheaper by buying 3com, waiting for the spinoff, and throwing away the 3com shares than directly -- a pure arbitrage opportunity. (My response to this fascinating episode, not the point here.)

Notice the huge short interest in Palm, the overpriced security. At the peak, 147% of Palm's shares have been sold short. OK, that's what you expect. But notice that 2.6 percent of 3com's shares are sold short too!

Now, who in the world was short  the long end of the greatest arbitrage opportunity of the century? Well, AQR (Cliff and John's fund), I bet. This was the tech boom, and any long-value short-growth strategy will think 3Com is also "overpriced.'' So long as the correlation matrix estimate does not notice that 3com and Palm are perfectly correated at a 6 month horizon -- they are not in daily and weekly data -- it will short 3com.

So, it's quite sensible that people who invest for other purposes end up looking kind of silly when you condition down to one predictor.  People who buy growth stocks and shun value stocks are looking for something else.

Not an answer, but a very interesting set of questions. And the rest of the essay is good too.

In the end, I find the whole "rational" vs. "behavioral" debate quite empty. Anything people have been fighting about for 40 years really can't make much sense, and debating whether whole classes of models are right or wrong is pretty empty. Gene's joint hypothesis theorem proved that 45 years ago. All methodological debates are pretty empty. We make progress by writing specific models and looking at data.

Behavioral finance is however excellent marketing for active managers -- each of whom tells you all the other guys are behavioral.

Saturday, March 8, 2014

Employment-Population Ratio: war of the graphs

The comments on my last post were particularly good, and pointed to some alternative graphs. And, I think, to the important conclusion, that there is no substitute really for sitting down and doing some economics.

To recap, I passed on Torsten Slok's Graph of employment-population ratio and fraction of the population 25 to 54. Torsten's view is that the lowered trend in employment population ratio comes from older people retiring on their newly flush 401(k) savings.

Mike Nigro answered quickly pointing to a New York Fed study by Samuel Kapon and Joseph Tracy summarized here and producing the next graph.

Samuel and Joseph have the same basic aim: figure out how much the employment-population ratio is falling just due to demographics anyway, and hence is not particularly indicative of the state of the labor market.

Rather than just look at the number of 25-54 year olds They divide people "into 280 different cohorts defined by each individual’s decade of birth, sex, race/ethnicity, and educational attainment," and then estimate age-employment profiles for each bin using a large pre-recession dataset.

Source: Samuel Kapon and Joseph Tracy
Here is their estimated profile for white non-Hispanic men born between 1950 and 1959, in five levels of education. So, if everyone in the economy got older, we push the "normal" employment population ratio to the right. And if demographics shifted in favor of people with less education (or, not shown, women, minorities etc. with lower "normal" employment-population ratios) we would again sum up and decide that the overall "normal" was lower.

But, more sophisticated also means more assumptions one can quibble with.

They estimated profiles using data through 2013, i.e. including the recession. They used a "full set of year effects" so that a shift downwards in everyone's employment doesn't affect the profiles. But the recession didn't hit everyone equally. If the recession hits old people more than young, even with year effects, we will see a recession-induced fall in the profile.

More deeply, "there is no overall intercept for our demographically adjusted E/P ratio—only variations over time. To determine an intercept, we adopt the normalization that over the thirty-one years in our data sample any business-cycle deviations between the actual and the adjusted E/P ratios will average to zero."

In English, looking back at the middle graph, you can slide the blue line up or down to anywhere you want it. Samuel and Joseph put the blue line in the middle of the red lines. But they could just as easily have had the blue line clip the tops of the red lines, and call it "potential" employment in the Keynesian tradition. Or higher still, they could have assumed that the employment of highly educated white men is "normal" and scored everything else as a shortfall. Torsten's graph uses a different scale (right) for the blue line as the red line (left). So there as well, the relative position of blue and red lines is totally arbitrary.

To be clear, all the authors are perfectly clear about this limitation. But if you look at the middle graph and conclude that we're close to some sort of "normal," you're jumping to a big conclusion.

Finally, neither graph by itself says everything is fine in the labor market. Is it "normal" that 40% of 50 year old white men with less than high school educations do not work at all? Is it written in human biology that there is a cliff in employment at 62 and 65? Or do both of these facts reveal people responding to economic incentives, many set up by government programs (in the latter case, medicare and social security rules) that may be less than ideal? Even if the employment-population ratio were to follow the blue line exactly, that does not mean all is well.  Our issue is no longer "recession" but "perpetually low growth."

So far, though, Samuel and Joseph's graph produces about the same result as Torsten's. Actually, it's stronger. Torsten felt that 54-65 year olds were retiring in unusually high numbers on stock market wealth -- something they didn't do in 1999 and 2006 -- while Samuel and Joseph say the decline is all demographics and the usual age earning profile.

Oliver Sherouse chimed in, linking to a graph he created from the St. Louis Fed's excellent Fred database.

"Just a gosh-dern minute here. If you graph the E/P ratio of just the 25-54 year olds, you get basically the same curve."

The blue line is the celebrated overall employment-population ratio. The red line is the employment-population ratio of 25-54 year olds. Good point Oliver! Joseph and Samuel could just as easily produce the time-series of employment in their 280 buckets. (Presuming they haven't done that somewhere else.)

Source: New York Times
A similar point from the New York Times, via Marginal Revolution, at left.

Still, none of these graphs really tell us how much of the overall decline in employment-population ratio is due to these "within-demographic" changes vs. the change in demographics and the "usual" differences in employment across demographics.  It looks like there is a bit of both.

Into the fray, Jim Bullard, St. Louis Fed President, has  a nice speech,  two weeks ago, a refined version of which will appear next week in the St. Louis Fed's economic review. The Fed too is puzzled -- unemployment is down, but the employment-population ratio has not recovered. Still weak "demand?" Now "supply" that the Fed can't do anything about?

Jim reviews a large scholarly literature. What I got out of this is, so far nobody has really clear answers. Well, knowing there isn't a clear answer out there is knowledge.

Echoing my thoughts above Jim says
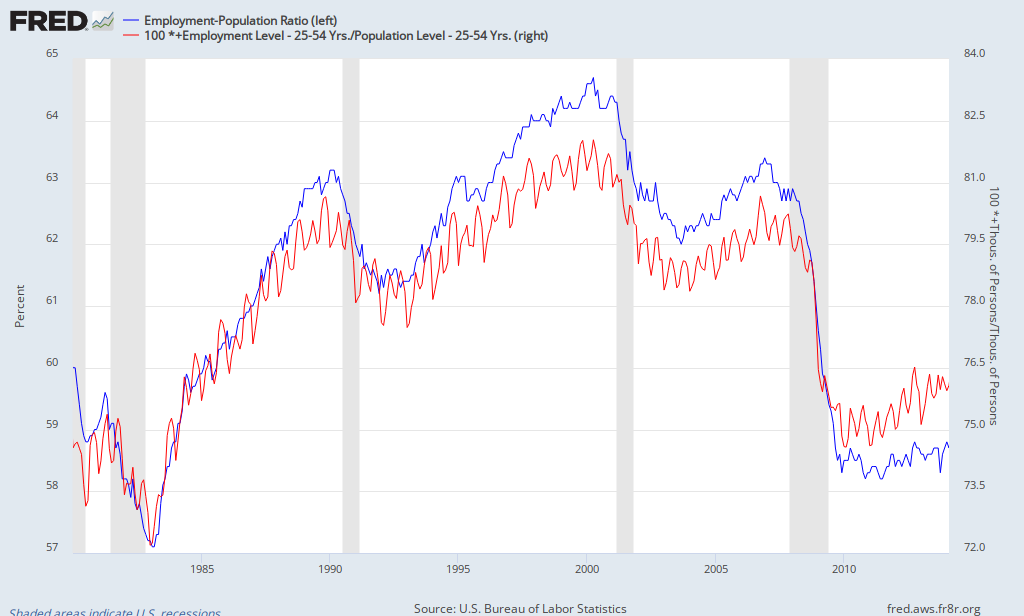
Much of the literature I have reviewed uses the same basic idea: Certain demographic groups have a certain propensity to participate in market work, and one of the main things we need to do as economists is project the number of people in each of these groups in order to determine a reasonable estimate of the expected (or “normal” or “trend”) labor force participation rate in the U.S. economy. Much of the literature concludes that demographics have contributed substantially to the observed decline in U.S. labor force participation since 2000.
Still, the literature as a whole is a bit hollow. Simply saying that people in certain demographic groups tend to make the participation decision one way or another does not do enough to analyze the incentives of household labor supply decisions. The more we know about the details of the household labor supply choices, including choices to participate in market work, the better we can predict the impact of policy on labor force participation. Furthermore, we would like these decisions to be part of the macroeconomic model, as Erceg and Levin suggest.
Here Jim speculates about the recent, and very worthwhile literature on "household production" that models the decision to work or not. He does not speculate on how much those decisions are distorted by policy. 40% of 40 year old white men are not perpetually choosing to be out of work, facing the full cost of that decision, to be artists, take the kids to soccer practice or even to repaint the living room walls.

The bottom line, I think, is simple. We want to know, is the employment-population ratio low because of generic lack of "demand," "discouraged workers" who have simply given up looking? Is it due to lack of "supply," either due to preferences and demography or due to labor market distortions? Is it due to the "normal" change in desire to work as people get older? What are the economic reasons that minority and less educated people work less than high education white males? It's as offensive to economics as to the people involved to write these employment-population differences as innate features of human beings. Is the decline due to the interaction of demographics with the disincentives provided by existing government programs? Is it due to the disincentives of new government programs -- long-lasting unemployment insurance, expanded food stamps, looming ACA, etc. etc? Is it due to the interaction of a recession with government programs -- people normally work, but once they get hit by a recession, they get stuck in the non-work state? How much is due to resistance, natural and artificial, to moving? How much is the skills mismatch? Job opportunities change from construction in Florida to computer programming in California, and people don't follow. Simple aggregate labor demand and supply can't address that.

Sadly, no simple graph answers those questions.

Update: 

From John Taylor's blog, Chris Erceg and Andrew Levin's  plot of the employment-population ratio and two projections of demographic effects, made ahead of time.


Thursday, March 6, 2014

Employment-Population ratio


Torsten Slok keeps making interesting graphs, which make a blogger's job easy.


Lately, there has been a pretty remarkable consensus among macroeconomists that the labor market really is not doing well, despite lower unemployment rate. About 10 million people lost their jobs in the great recession,  and new employment has just about matched new people since then. The employment-population ratio -- red line -- hasn't budged. The 10 million aren't actively looking for work, so they don't count as "unemployed." Whether "discouraged" by persistent "lack of demand" or discouraged by high marginal taxes and social program disincentives, or bad match of skills and opportunities, take your pick, the consensus view on all sides has been pretty dim on the labor market.  I've seen about the same slide deck from Ed Lazear (Bush CEA chair) and Larry Summers (Obama adviser). Usually, employment and unemployment mirror each other, so it doesn't matter which measure you use.

In Torsten's view, there is nothing the Fed can do about this. I agree. The Fed seems to secretly agree too. They talk about the employment-population ratio, but if they thought there were effectively 10 million unemployed and they could do something about it, they would not be even talking about tapering, they'd be talking about buying another $2 trillion of bonds and promising zero rates into the 7th year of the Hilary Clinton administration.

But to the point of the graph: apparently, the share of 25-54 year olds mirrors this long-run trend in employment-population ratio. In Torsten's view, the 55-65 year olds made a lot of money in their 401(k)s and are retired. (The range of the vertical axes is the same, so though not quite counting people, it's close. Beware correlations among series with different vertical axes!)

I'm not quite so optimistic. The average $650,000 net worth Torsten cites is nowhere near enough to live on for 30-35 years, much of this is in housing, and half the households have less. As a member of that demographic, I think there is a lot of useful work to be had out of 55-65 year olds. The same numbers can be read dreadfully as a generation whose location, skills, health insurance arrangements, marginal tax rates (social security disability, etc.) and now long-term unemployment history leave them behind, facing a long painful old age, and the economy without their contributions.

Still, I hadn't really been thinking about demographics in the context of the employment-population ratio, and it's important. Long-run growth of the economy and tax revenue needs overall employment to rise. If the 55+ are forever out of the labor force, we'd better let some young smart taxpayers in pretty fast!